The GDP for Sri Lanka for the third quarter of 2015 (July - September) reached 2,158,327 million rupees and the economic growth rate of the country for the first three quarters has been estimated as 5.2 percent, the DCS
The full statement by the Department of Census and Statistics under the Ministry of National Policy and Economic Development follows:
Gross Domestic Product by Production Approach – 3rd Qtr 2015
The Gross Domestic Product for Sri Lanka for the third quarter of 2015 (July, August, September) reportedly reached up to Rs. Million 2,158,327. The GDP value reported for the third quarter of 2014 was Rs. Million 2,059,070 resulting a positive growth rate of 4.8 percent for the third quarter of 2015. Further the economic growth rate of the country for the first three quarters has been estimated as 5.2 percent.
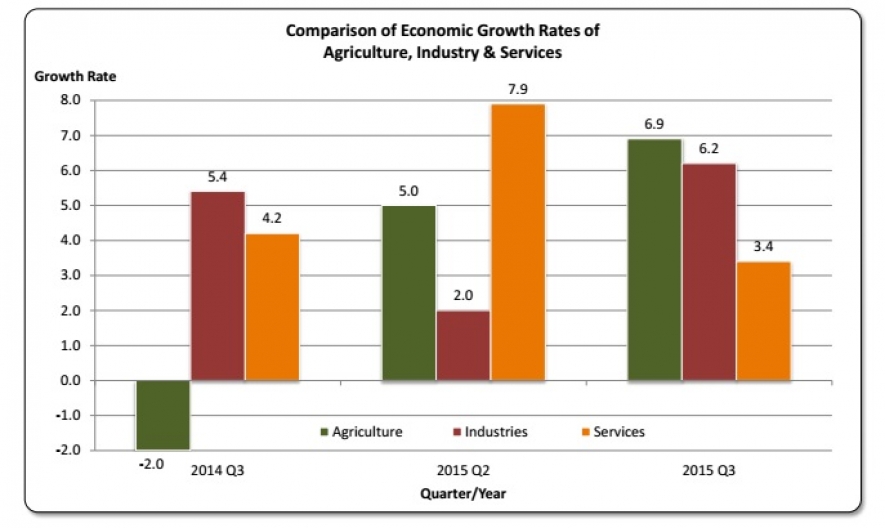
The four major components of the economy: Agriculture, Industry, Services and Taxes less subsidies has contributed their share to the total GDP at Constant price (2010) by 7.2 percent, 26.7 percent, 57.1 percent and 9.0 percent respectively in the third quarter of 2015. During the third quarter of 2015, all the three major economic activities have shown a significance increase in the growth rates. It reported 6.9 percent, 6.2 percent and 3.4 percent growth rates respectively for Agriculture, Industries and Services activities.
Among the sub activities of Agriculture, ‘Growing of rice’ reported a very high growth (61.1 percent) and ‘Growing of oleaginous fruits; including coconut’ reported 7.9 percent of increase during the third quarter of 2015, compared to the same quarter of 2014. Meanwhile ‘Growing of tea’ and ‘Marine fishing’ suffered major falls in the growth rates as 3.9 percent and 8.6 percent respectively during this quarter.
Among the industrial activities, the sub activities of ‘Mining and quarrying’, ‘Manufacture of food, beverages and tobacco’ and ‘Manufacture of wood and products of wood’ have shown a striking increase of 9.6 percent, 8.8 percent and 35.2 percent respectively, during the third quarter of 2015. In addition the ‘Manufacture of textile and wearing apparel’ and ‘Manufacture of chemical products’ activities have reported a decline of 2.4 percent and 4.2 percent respectively, over the period of under consideration.
During the third quarter of 2015, specially the sub activities of ‘Telecommunication’, ‘Financial service activities’, ‘Insurance, reinsurance and pension funding’ and ‘Wholesale and retail trade’ have experienced a significance increase in the growth rates by 18.9 percent, 11.1 percent, 16.1 percent and 5.6 percent respectively. In the meantime the sub activities of ‘Accommodation, food and beverage serving activities’, Professional services’, ‘Education’ and ‘Human health activities’ experienced declines of the growth rates by 1.7 percent, 19.6 percent, 9.2 percent and 6.7 percent respectively, during the period of concern.
Gross Domestic Product by Expenditure Approach – 2010 to 2014 (Annual estimates)
GDP by Expenditure Approach measures the value of goods and services produced in terms of the expenditure or consumption by institutional sectors namely; households, government, financial institutions, non-financial institutions, and Non-profit Institutions serving Households (NPISH). The GDP by Expenditure approach is comprised by mainly, Final Consumption Expenditure, Gross Capital Formation and External Balance of Goods and Services. In year 2014, the first two major components have been contributed to the total GDP by 74.8 percent, 33.1 percent respectively and External Balance of Goods and Services have been contributed negatively to the total GDP by 7.9 percent.
Gross Domestic Product by income Approach – 2010 to 2014 (Annual estimates)
The Gross Domestic Product by Income approach measures the income generated by the production process of each sectors namely Non Financial institutions, Financial institutions, General Government, Household and Non-profit Institutions serving Households. It is consisted mainly by Compensation of employees, Net operating surplus, Mixed income, Other taxes less subsidies on production, Consumption of fixed capital and Taxes less subsidies on products. These components shared the GDP by 26.5 percent, 49.3 percent, 6.2 percent, 2.2 percent, 6.5 percent and 9.3 percent respectively in year 2014.